🛠️ Using Dataflow
User Interface
Dataflow aims to make the User experience as straight forward as possible, offering a simple UI with basic but powerful controls.
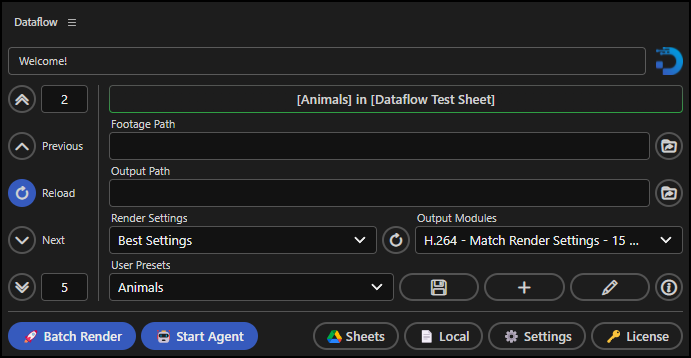
Look of the UI is subject to changes, this should give you a basic Idea of the tools structure.
Creating dynamic elements
In order to make certain elements in your After Effects project dynamic, you need to tag them in a way that dataflow knows where to apply the data from your data source.
Tagging Text Layers
To make a text layer in your project dynamic, navigate to the text layer and add a "data" comment.
Make sure to match the text layers name with the column header in your data source.
This tells Dataflow to replace the text content of that layer with the data from the corresponding column in your data source.
Tagging Images
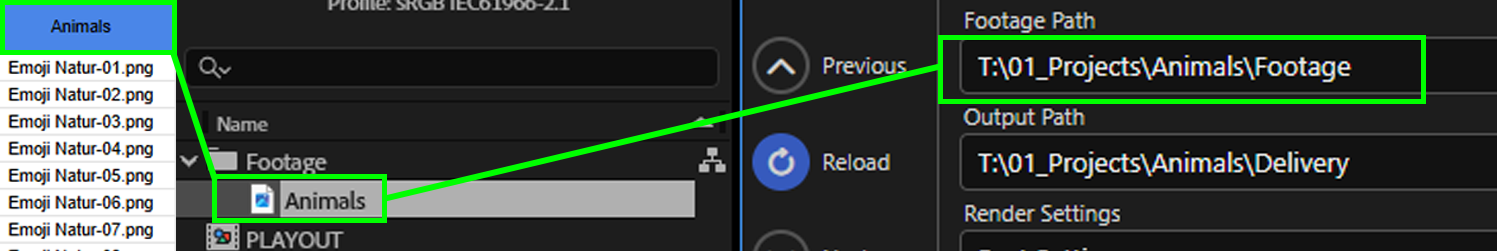
To make an image in your project dynamic, make sure to match the image name in your project panel with the column header in your data source.
In your Footage Path in Dataflows UI, link to the folder where your images are stored.
In your data source, map the image file names (including file extension) to the corresponding column header.
Connecting Data
Local Data Sources
To connect local data files (.tsv or .json), press the 📄 Local Button at the bottom of the UI.
To connect local data sources:
- Select your file/s in the file picker
- Then press the Connect Local Data Button
Google Sheets
To connect Google Sheets, press the  Sheets Button at the bottom of the UI.
To connect a Google worksheet:
- Follow the Google Authorization steps in the Google Sheets documentation
- Select and expand a Google Sheet
- Select your desired Worksheet
- Press the + Button to add it to your connected Sheets section
- Optionally, add multiple Worksheets if you are using the Agent
- Press the Connect Worksheet/s Button
Note
Loading the Sheets could take a short amount of time, depending on the amount of Sheets and your internet connection speed!
Note
Dataflow will only display the Google Sheets where you are either the owner or editor.
Agent Mode would not be able to update the render-status in read only files.
Previewing Data
When creating a project with dynamic data, you will want to preview how different data looks in your media. The preview panel allows you to easily preview inputs from your connected data source. Just put in the row range of your data source top->bottom and conveniently cycle through your data rows.
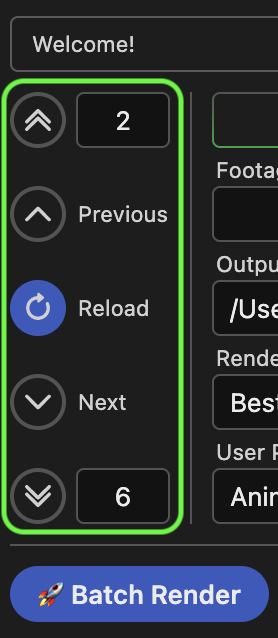
Pressing any of the preview navigation buttons will always update the data live, so in case you wanna make any changes in between they will load as soon as you hit reload on the same row or naviagte to the updated row.
Note
For .tsv and Google Sheet data, the first row can not be previewed because it is reserved for the column header.
User Presets
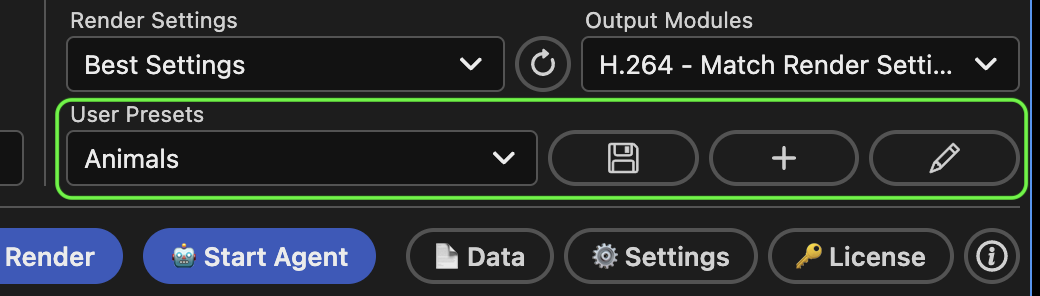
The highlighted section above is for managing User Presets in Dataflow.
User Presets allow you to save all your input parameters to a custom named selectable setting.
Say you got two campagins which need completely different input data, render settings etc, you can create a User Preset for each and easily switch between them whenever you are working on each project.
Note
The Google API credentials in ⚙️Settings are applied globally and not per user preset, since you generally only set it up once and use the same credentials.